Peeling your data layer by layer, the story behind our logo.
Branding is an important step in creating a public perception for your company or product. It builds an emotional bonding with your customers, and instant identification starts with the logo. The latter communicates a message, idea, or philosophy, and it’s something your business will definitely be associated with.
Obviously, we put a lot of thought into constructing the concept and design for our own little child, Dataplayer. From the original inspiration behind the logo to the final product, this is the story behind how everything went down.
And it starts with, drum rolls, please…
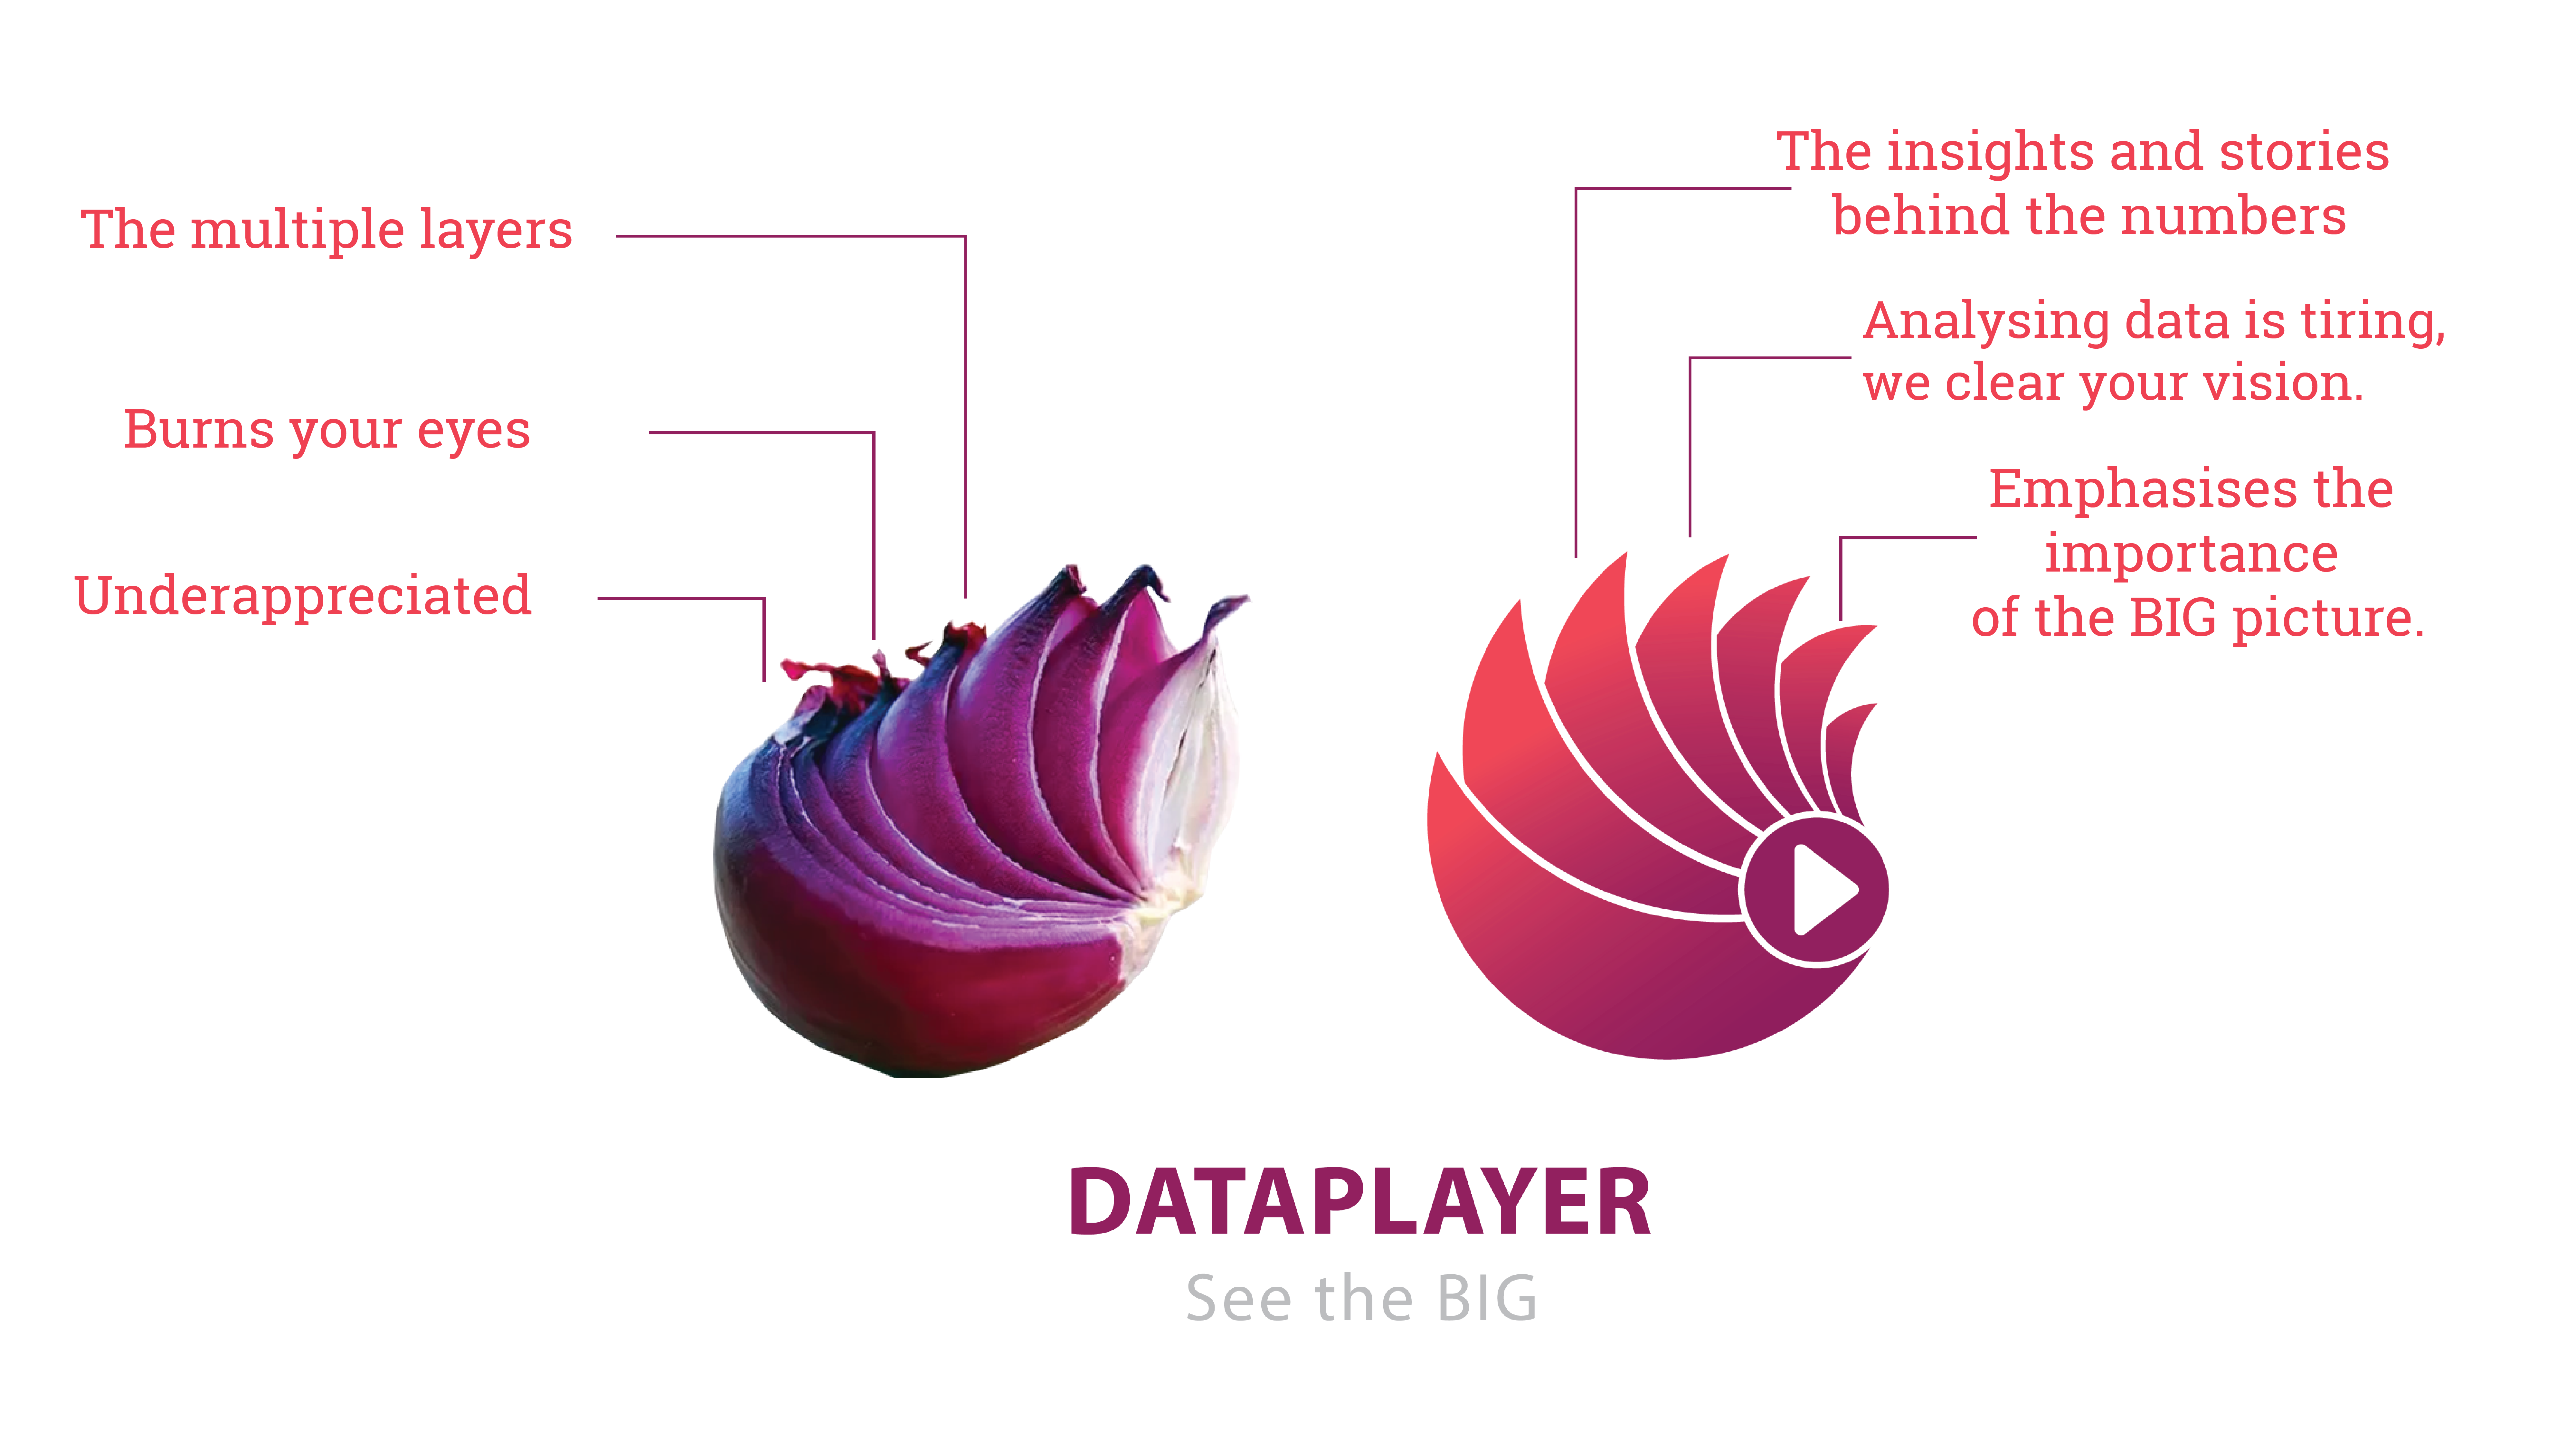
You saw that right! This red onion is what represents the platform that collects, transforms and helps you visualize your data. Might seem a little bizarre, so let us elaborate.
The multiple layers
They don’t simply represent the complexity of the information data can offer us, but the endless insights and stories that lay in it. Numbers are simply numbers when they don’t undergo a proper analysation. Data can hold vastly important information, especially in understanding the bigger picture of how your business is doing. But it can also be overwhelming. Navigating how to put those layers of numbers into context, is where Dataplayer takes the lead.
Look at it for too long, and your eyes start watering
Cutting onions as a metaphor to crying is a saying as old as time. The chemical irritants, tiring your eyes, can be present in your data as well.
Ever looked at your numbers, graphs, and measurements for too long, and felt like your brain was melting?
All that information can be exhausting, so we like to offer some proper filtering, that will most likely calm your eyes, mind, and hectic decision-making.
Underappreciated, and often looked down upon.
As mundane as a vegetable can be, the red onion is probably considered as the least sophisticated one. However, those flavoured bulbs offer us endless nutritional values. They contain antioxidants and sulfur-containing compounds. They have antioxidant and anti-inflammatory effects and have been linked to a reduced risk of cancer, lower blood sugar levels, and improved bone health.
So, appreciate the benefits your data has to offer, and the stories it can tell. The bigger picture drives actionable insights for better decision-making, and this is a philosophy we endure throughout our platform and as a brand.